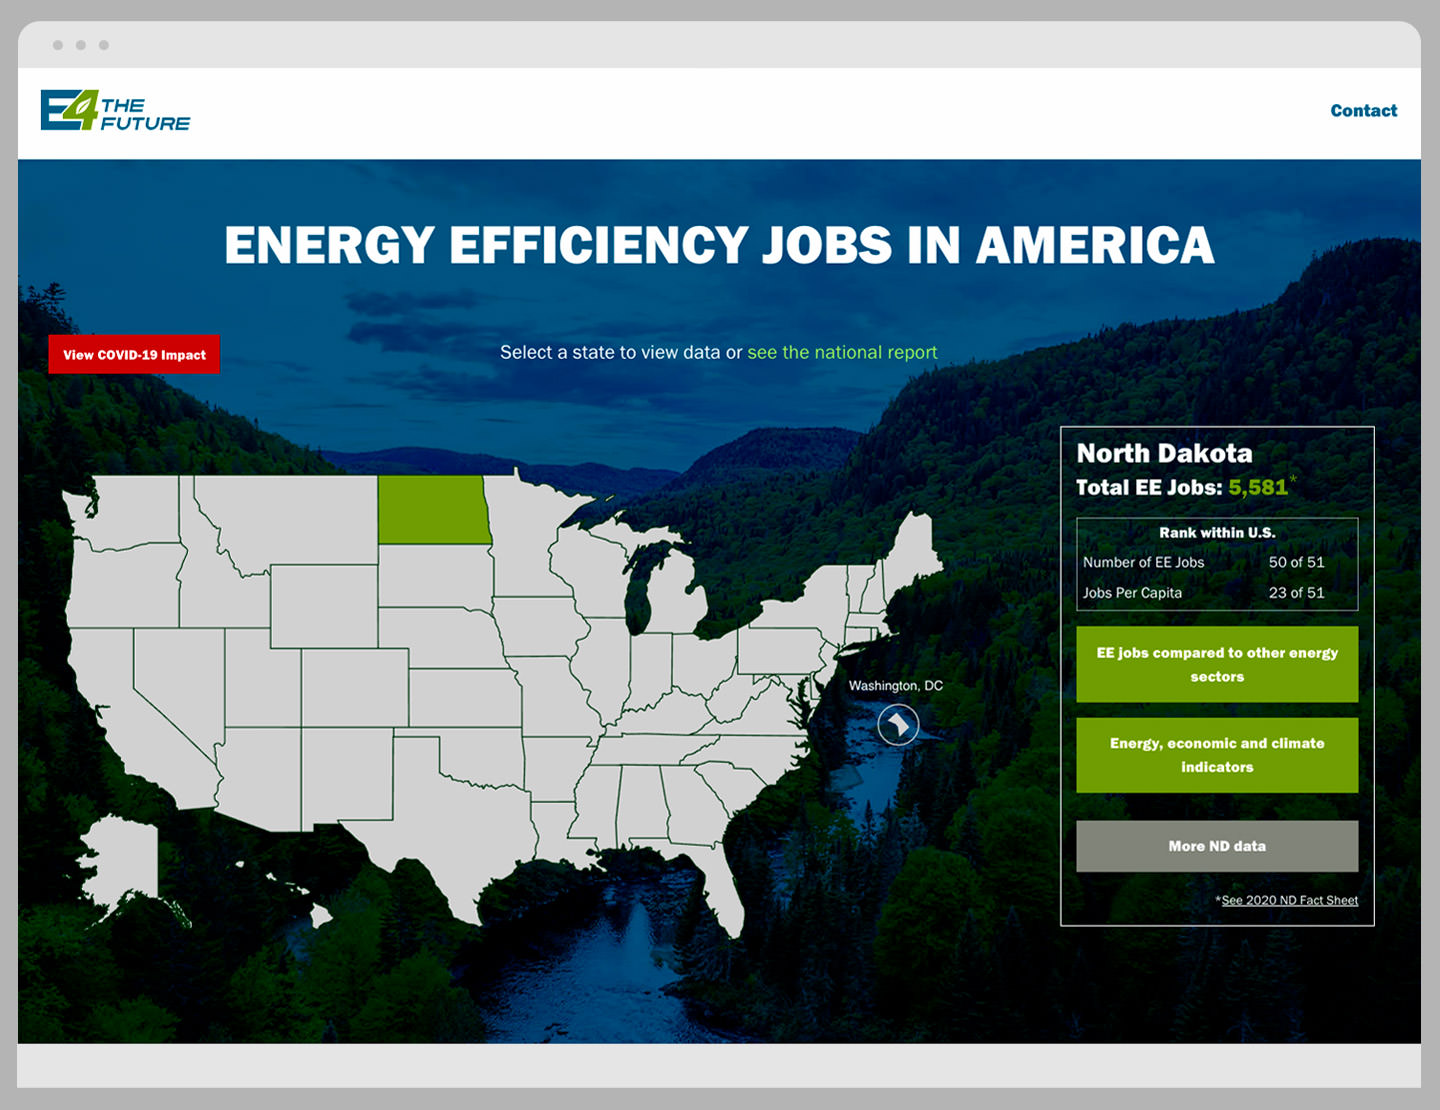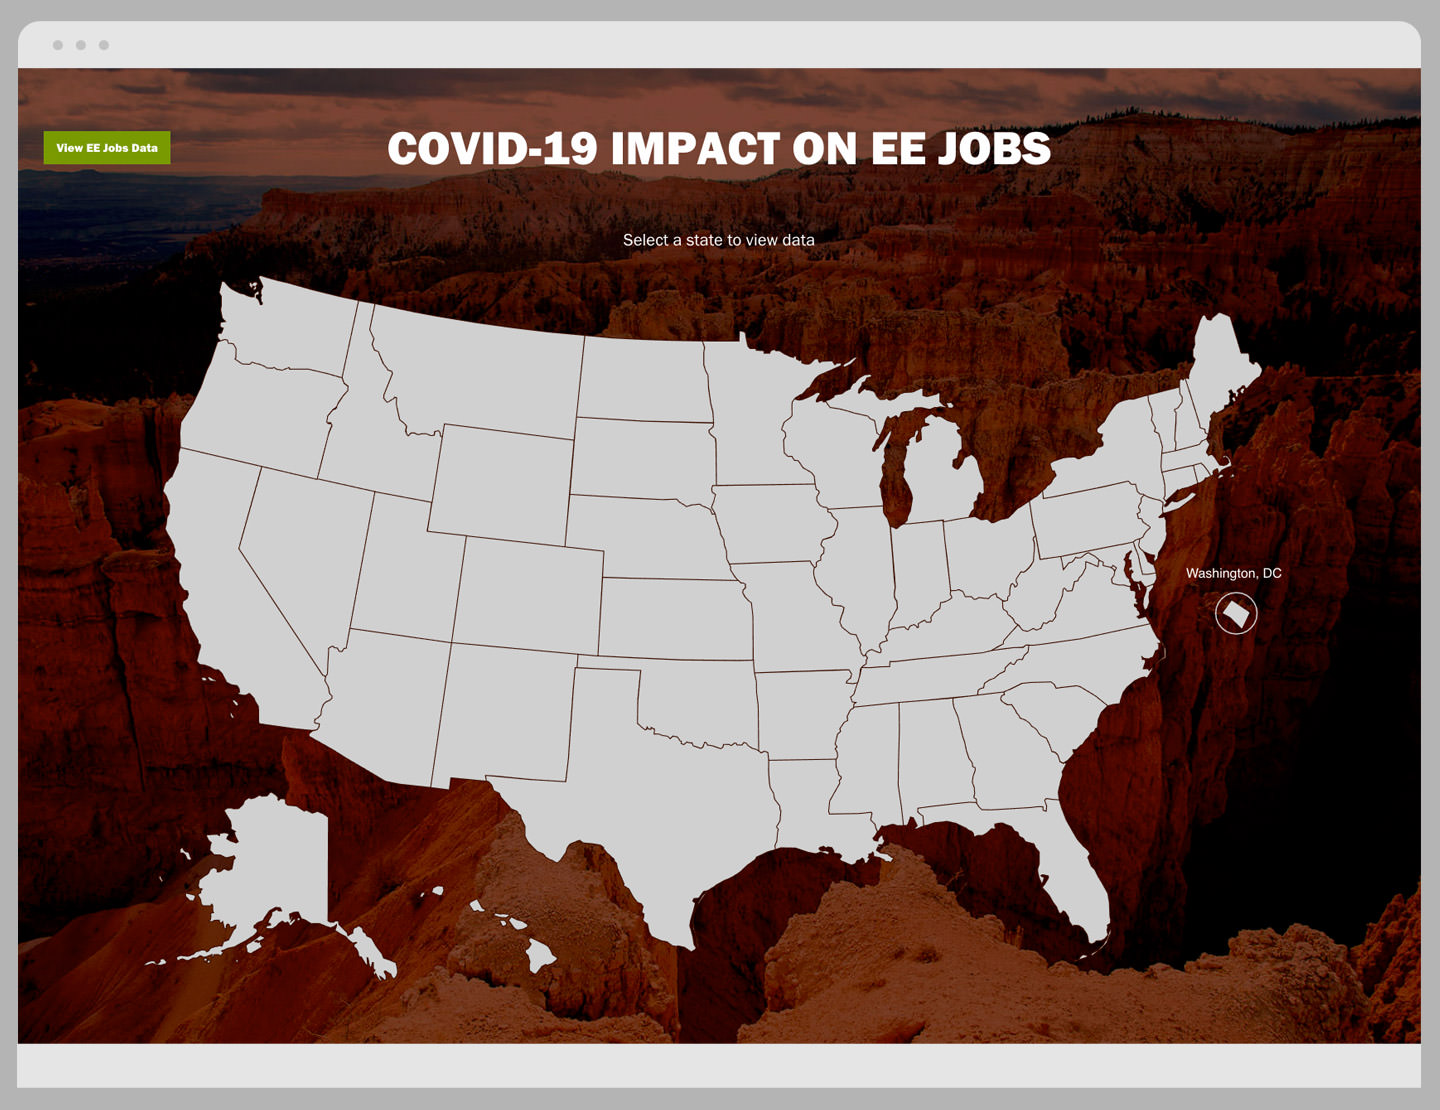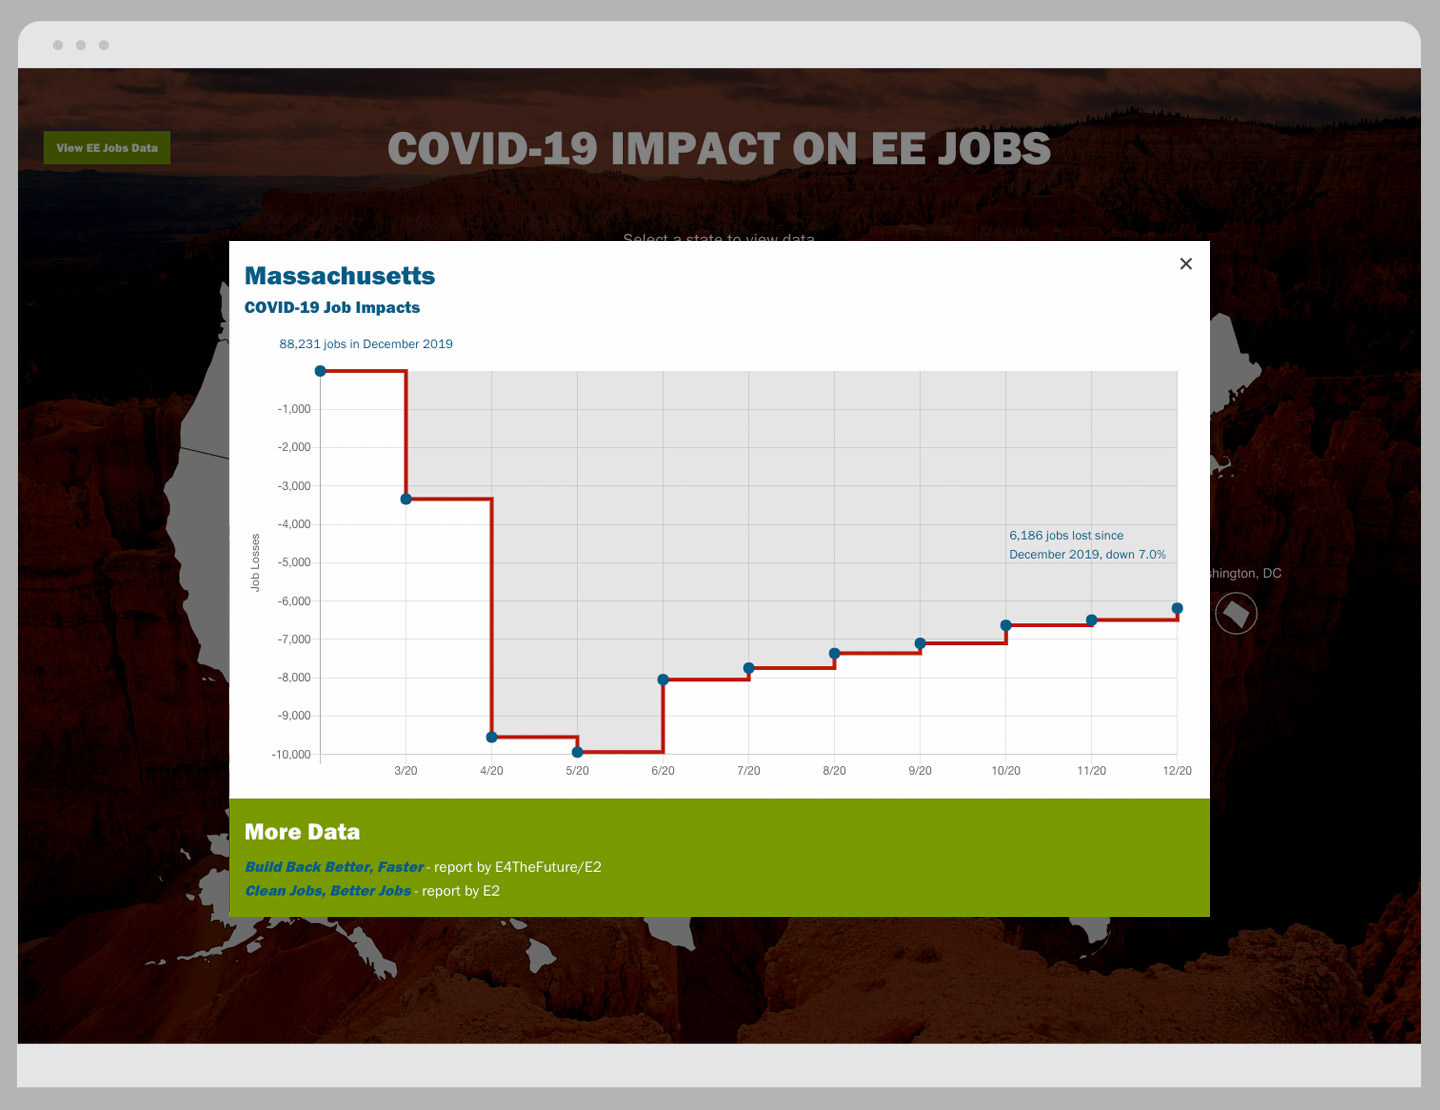

E4TheFuture publishes an annual report analyzing energy efficiency jobs gains and losses in the U.S. State-by-state information includes comparison data for sectors within the energy industry. The 2020 report is unique in that it details the sharp drop in employment due to COVID-19.
Due to the large amounts of data, information needs to be organized and displayed in a way that is easy to find and digest. The website will be viewing the site on all types of devices; mobile, tablet, and desktop screens, so optimization for various screen sizes is paramount.
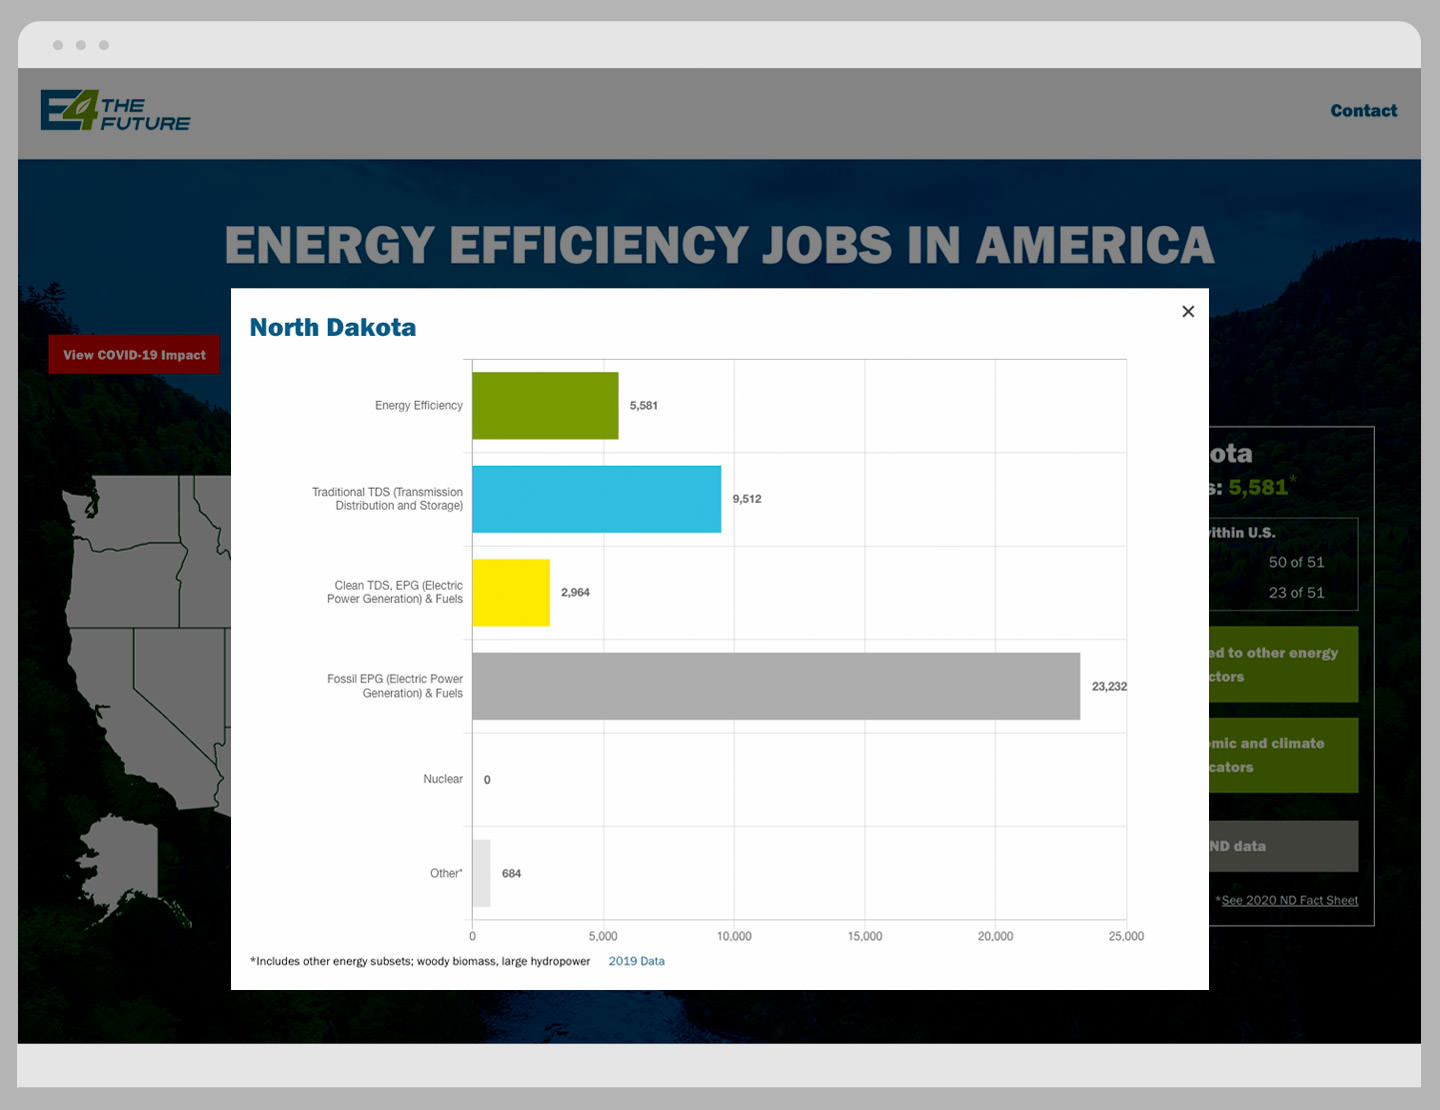
A clean, simple interface with bold graphics and colors provides an engaging environment while providing a clear path to various data categories. Data is broken out into two categories; pre- and post-COVID. Animated charts engagingly depict the information, which is presented through simple line and bar graphs.
A large amount of energy efficiency job data is easy to access and neatly organized for speedy consumption.
